import numpy as np
import matplotlib.pyplot as plt
import pandas as pd
from mpl_toolkits.mplot3d import Axes3D
people = np.arange(1, 11)
total_cost=np.ones_like(people) * 20print(people, total_cost)[ 1 2 3 4 5 6 7 8 9 10] [20 20 20 20 20 20 20 20 20 20]
ax = plt.gca()
ax.plot(people, total_cost)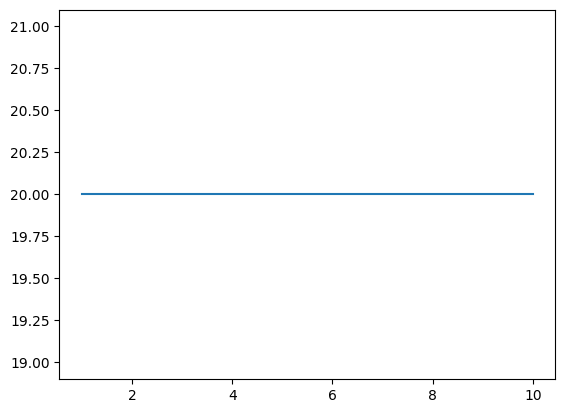
trosak = 40 * people + 20display(pd.DataFrame({'trosak': trosak.astype(np.int64)}, index=people).T)
ax = plt.gca()
ax.plot(people, trosak, 'yo')
ax.set_ylabel("Ukupno")
ax.set_xlabel("Ljudi")Loading...
def dorada(ax):
    ax.spines['left'].set_position(('data', 0.0))
    ax.spines['bottom'].set_position(('data', 0.0))
    ax.spines['right'].set_visible(False)
    ax.spines['top'].set_visible(False)
    def make_ticks(lims):
        lwr, upr = sorted(lims)
        lwr = np.round(lwr).astype('int')
        upr = np.round(upr).astype('int')
        if lwr * upr < 0:
            return list(range(lwr, 0)) + list(range(1,upr+1))
        else:
            return list(range(lwr, upr+1))
    import matplotlib.ticker as ticker
    xticks = make_ticks(ax.get_xlim())
    yticks = make_ticks(ax.get_ylim())
    ax.xaxis.set_major_locator(ticker.FixedLocator(xticks))
    ax.yaxis.set_major_locator(ticker.FixedLocator(yticks))
    ax.set_aspect('equal')
xs = np.linspace(-3, 3, 100)
a, b = 1.5, -3
ax = plt.gca()
ys = a * xs + b
ax.plot(xs, ys)
ax.set_ylim(-4, 4)
dorada(ax)
ax.plot(0, -3, 'ro')
ax.plot(2, 0, 'ro')
ys = 0 * xs + b
ax.plot(xs, ys, 'y')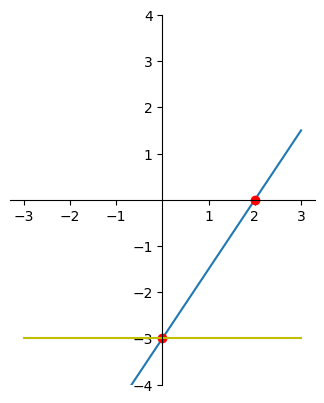
xs = np.linspace(-3, 3, 100)
xs_p1 = np.c_[xs, np.ones_like(xs)]
display(pd.DataFrame(xs_p1).head())
w=np.array([1.5, -3])
ys = np.dot(xs_p1, w)
display(pd.DataFrame(ys).head())
ax = plt.gca()
ax.plot(xs, ys)
ax.set_ylim(-4, 4)
dorada(ax)
ax.plot(0, -3, 'ro')
ax.plot(2, 0, 'ro')
Loading...
broj_ljudi = np.arange(1, 11)
broj_piva = np.arange(0, 20)
print(broj_ljudi, broj_piva)

broj_ljudi, broj_piva = np.meshgrid(broj_ljudi, broj_piva)
ukupno = 40 * broj_ljudi + 5 * broj_piva + 20
print(ukupno)
[ 1 2 3 4 5 6 7 8 9 10] [ 0 1 2 3 4 5 6 7 8 9 10 11 12 13 14 15 16 17 18 19]
[[ 60 100 140 180 220 260 300 340 380 420]
[ 65 105 145 185 225 265 305 345 385 425]
[ 70 110 150 190 230 270 310 350 390 430]
[ 75 115 155 195 235 275 315 355 395 435]
[ 80 120 160 200 240 280 320 360 400 440]
[ 85 125 165 205 245 285 325 365 405 445]
[ 90 130 170 210 250 290 330 370 410 450]
[ 95 135 175 215 255 295 335 375 415 455]
[100 140 180 220 260 300 340 380 420 460]
[105 145 185 225 265 305 345 385 425 465]
[110 150 190 230 270 310 350 390 430 470]
[115 155 195 235 275 315 355 395 435 475]
[120 160 200 240 280 320 360 400 440 480]
[125 165 205 245 285 325 365 405 445 485]
[130 170 210 250 290 330 370 410 450 490]
[135 175 215 255 295 335 375 415 455 495]
[140 180 220 260 300 340 380 420 460 500]
[145 185 225 265 305 345 385 425 465 505]
[150 190 230 270 310 350 390 430 470 510]
[155 195 235 275 315 355 395 435 475 515]]
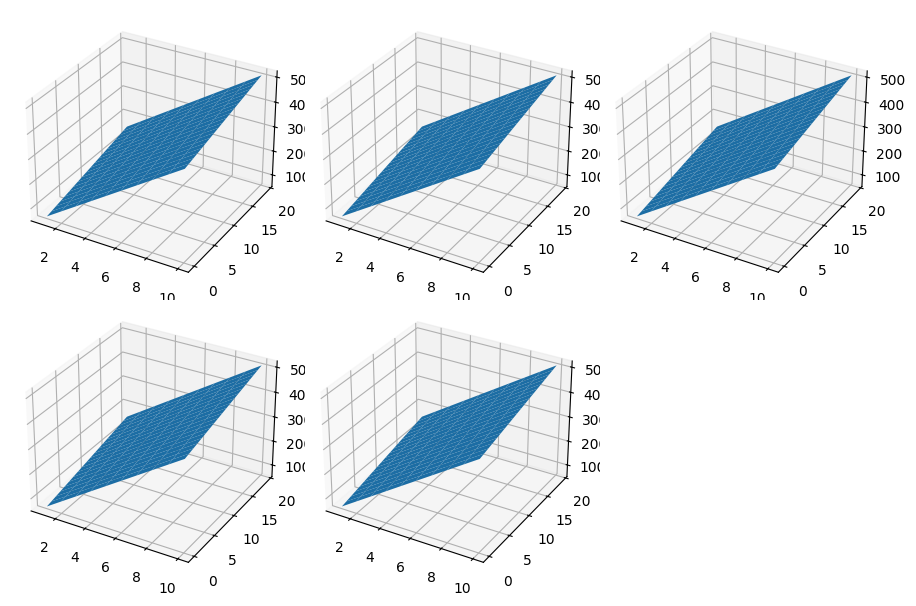
fig, axes = plt.subplots(2, 3, subplot_kw=dict(projection='3d'), figsize=(9, 6))
kutevi = [0, 45, 90, 135, 180]
for ax, angle in zip(axes.flat, kutevi):
    ax = ax.plot_surface(broj_ljudi, broj_piva, ukupno)
    #ax.set_xlabel("Ljudi")
    #ax.set_ylabel("Pivo")
    #ax.set_zlabel("Ukupno")
    ax.azim = angle

axes.flat[-1].axis('off')
plt.tight_layout()