import numpy as np
import pandas as pd
from sklearn.model_selection import train_test_split
from sklearn.neighbors import KNeighborsClassifier
from sklearn.metrics import (
    confusion_matrix, accuracy_score, precision_score,
    recall_score, f1_score, classification_report, roc_curve, roc_auc_score)
import matplotlib.pyplot as plt
data = pd.DataFrame({
"shoe_size_eu": [36, 37, 38, 39, 40, 41, 42, 43, 44, 45, 38, 39, 39, 42, 42],
"gender": ["F","F","F","F","F","M","M","M","M","M","F","F","M","M","F"]
})x = data[["shoe_size_eu"]].values
y = data["gender"].valuesx_train, x_test, y_train, y_test = train_test_split(x, y, test_size=0.66, random_state=41, stratify=y)
knn = KNeighborsClassifier(n_neighbors=3)
knn.fit(x_train, y_train)
predictions_proba = knn.predict_proba(x_test) # Predict probability instead of values
predictions = knn.predict(x_test)
print(predictions_proba)
print(predictions)[[1. 0. ]
[0.33333333 0.66666667]
[1. 0. ]
[0.33333333 0.66666667]
[1. 0. ]
[1. 0. ]
[0.66666667 0.33333333]
[0.33333333 0.66666667]
[1. 0. ]
[0.33333333 0.66666667]]
['F' 'M' 'F' 'M' 'F' 'F' 'F' 'M' 'F' 'M']
print("Predikcija", predictions)
print("Istina", y_test)
Predikcija ['F' 'M' 'F' 'M' 'F' 'F' 'F' 'M' 'F' 'M']
Istina ['F' 'M' 'M' 'M' 'F' 'F' 'M' 'M' 'F' 'F']
labels_mf = ['M', 'F']cm = confusion_matrix(y_test, predictions, labels=labels_mf)
print(cm)[[3 2]
[1 4]]
Točnost (engl. accuracy)
accuracy_score(y_test, predictions)0.7Preciznost (engl. precision)
precision_score(y_test, predictions, pos_label="M")0.75Odziv (engl. recall)
recall_score(y_test, predictions, pos_label="M")0.6F1
f1_score(y_test, predictions, pos_label="M")0.6666666666666666Classification report
print(classification_report(y_test, predictions, labels=labels_mf)) precision recall f1-score support
M 0.75 0.60 0.67 5
F 0.67 0.80 0.73 5
accuracy 0.70 10
macro avg 0.71 0.70 0.70 10
weighted avg 0.71 0.70 0.70 10
labels_fm = ['F', 'M']
cm = confusion_matrix(y_test, predictions, labels=labels_fm)
print(cm)
print(accuracy_score(y_test, predictions))
print(precision_score(y_test, predictions, pos_label="F"))
print(recall_score(y_test, predictions, pos_label="F"))
print(f1_score(y_test, predictions, pos_label="F"))
[[4 1]
[2 3]]
0.7
0.6666666666666666
0.8
0.7272727272727273
y_pred_stat = predictions_proba[:, 1]
print(y_pred_stat)
[0. 0.66666667 0. 0.66666667 0. 0.
0.33333333 0.66666667 0. 0.66666667]
fpr, tpr, thresholds = roc_curve(y_test, y_pred_stat, pos_label="M")
roc_matrix = np.column_stack((tpr, fpr, thresholds))
print(roc_matrix)
[[0. 0. inf]
[0.6 0.2 0.66666667]
[0.8 0.2 0.33333333]
[1. 1. 0. ]]
target_recall = 0.9
idx = np.where(tpr >= target_recall)[0]
thr_for_recall = thresholds[idx[0]] if len(idx) > 0 else 0.5
print(thr_for_recall)
0.0
y_pred_custom = (y_pred_stat >= 0.3).astype(int)
print(y_pred_custom)
print(np.where(y_test == "M", 1, 0))
[0 1 0 1 0 0 1 1 0 1]
[0 1 1 1 0 0 1 1 0 0]
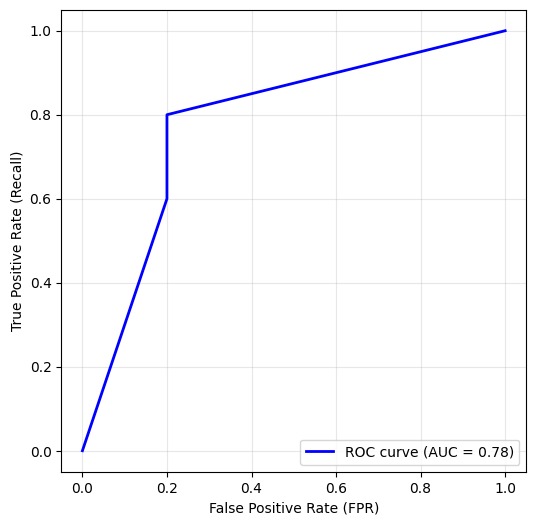
fpr, tpr, thresholds = roc_curve(y_test, y_pred_stat, pos_label='M')
roc_auc = roc_auc_score(y_test, y_pred_stat)
roc_df = pd.DataFrame({
    "FPR": fpr,
    "TPR": tpr,
    "Threshold": thresholds
})
print(roc_df.head(20))  # ispis prvih 10 redova
plt.figure(figsize=(6,6))
plt.plot(fpr, tpr, color="blue", lw=2, label=f"ROC curve (AUC = {roc_auc:.2f})")
plt.xlabel("False Positive Rate (FPR)")
plt.ylabel("True Positive Rate (Recall)")
#plt.title("ROC krivulja")
plt.legend(loc="lower right")
plt.grid(alpha=0.3)
plt.show()
FPR TPR Threshold
0 0.0 0.0 inf
1 0.2 0.6 0.666667
2 0.2 0.8 0.333333
3 1.0 1.0 0.000000