import numpy as np
import matplotlib.pyplot as plt
import scipy.stats as ss
b = ss.distributions.binom
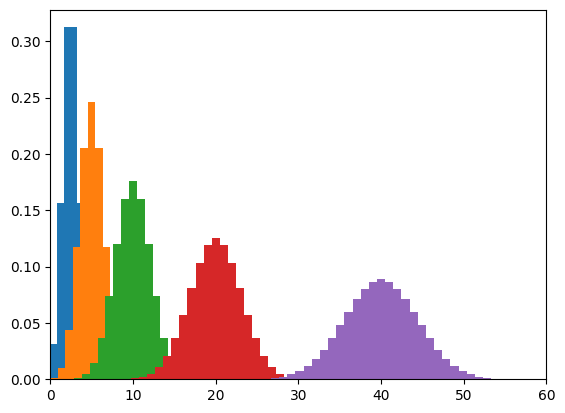
for broj_bacanja in [5, 10, 20, 40, 80]:
uspjeh = np.arange(broj_bacanja)
distribucija = b.pmf(uspjeh, broj_bacanja, 0.5)
plt.hist(uspjeh, broj_bacanja, weights=distribucija)
plt.xlim(0, 60)(0.0, 60.0)